The Largevars R package conducts a cointegration test for high-dimensional vector autoregressions of order \(k\) based on the large \(N,T\) asymptotics of Bykhovskaya and Gorin (2021, doi:10.48550/arXiv.2006.14179), Bykhovskaya and Gorin (2022, doi:10.48550/arXiv.2202.07150). The implemented test is a modification of the Johansen likelihood ratio test. In the absence of cointegration the test converges to the partial sum of the Airy\(_1\) point process. This package contains simulated quantiles of the first ten partial sums of the Airy\(_1\) point process that are precise up to the first \(3\) digits.
You can install the latest version of Largevars from Github:
library(devtools)
install_github("eszter-kiss/Largevars")
You can also install the latest CRAN release:
install.packages("Largevars")The following example is a replication of the S&P100 example from Bykhovskaya and Gorin (2022), Bykhovskaya and Gorin (2024).
We use logarithms of weekly adjusted closing prices of assets in the
S&P100 over ten years (01.01.2010-01.01.2020), which gives us \(\tau=522\) observations across time. The
S&P100 includes 101 stocks, with Google having two classes of
stocks. We use 92 of those stocks, those for which data were available
for our chosen time period. Only one of Google’s two listed stocks is
kept in the sample. Therefore, \(N =
92\), \(T = 521\) and \(T/N \approx 5.66\). The data that we use
are accessible from the data folder in the package.
library(Largevars)
## load data
data("s_p100_price")
## Transform data according to researcher needs
dataSP <- log(s_p100_price[, seq(2, dim(s_p100_price)[2])])
## Turn data frame into numeric matrix to match function requirements
dataSP <- as.matrix(dataSP)
## Use the package documentation by calling help
?largevar
## Use largevar function. Save the function output (list)
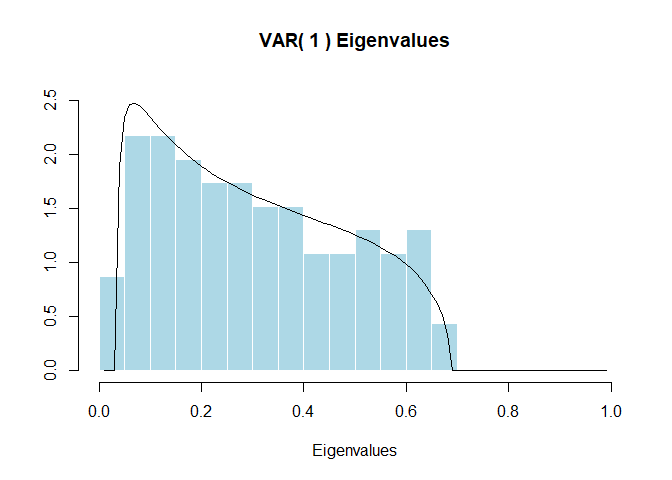
result <- largevar(data = dataSP, k = 1, r = 1, fin_sample_corr = FALSE,
plot_output = TRUE, significance_level = 0.05)
## Display the result
result
#> Output for the largevar function
#> =================================
#> Cointegration test for high-dimensional VAR(k)   T= 521 N= 92
#>
#>  10% Crit. value 5% Crit. value 1% Crit. value Test stat.
#>             0.45           0.98           2.02      -0.28
#>
#> If the test statistic is larger than the quantile, reject H0.
#> ===============================================================
#> Test statistic: -0.2777314
#> The p-value is  0.23
#> Decision about H0:  0
If we want to individually access certain values from the output list, we can do it in the usual way, by referencing the elements of the list:
result$significance_test$p_value
#> [1] 0.23
result$significance_test$boolean_decision
#> [1] 0
result$significance_test$significance_table
#>      10% Crit. value 5% Crit. value 1% Crit. value  Test stat.
#> r=1             0.45           0.98           2.02  -0.2777314
#> r=2            -1.87          -1.09           0.42  -1.4995879
#> r=3            -5.90          -4.90          -2.99  -5.4154889
#> r=4           -11.35         -10.15          -7.87 -10.5527603
#> r=5           -18.07         -16.69         -14.07 -16.7460847
#> r=6           -25.95         -24.40         -21.45 -23.2178976
#> r=7           -34.90         -33.19         -29.95 -31.1080001
#> r=8           -44.88         -43.01         -39.47 -39.3197363
#> r=9           -55.82         -53.80         -49.99 -49.8419822
#> r=10          -67.70         -65.53         -61.45 -60.4894485
If we want to see an empirical p-value, we can use the function
below. By default, it will print a message to console to remind the user
that precise computations of the statistics need a large number of
simulation iterations. We can suppress this message the usual way, by
using the suppressMessages() wrapper. We can set a seed for
the simulation by specifying a number for input seed.
## sim_function for empirical p-values
result2 <- sim_function(N = 92, tau = 522, stat_value = result$statistic,
                        k = 1, r = 1, fin_sample_corr = FALSE, sim_num = 1000, seed = 333)
#> Warning in check_input_simfun(N, tau, stat_value, k, r, fin_sample_corr, :
#> Simulation may run for several minutes
#> This function should only be used for quick approximate assessments, as precise computations of the statistics need much larger numbers of simulations.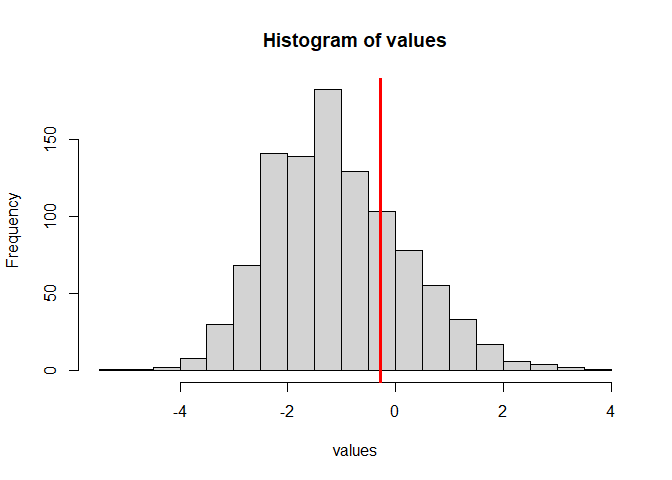
## To provide the function while suppressing messages:

# result3 <- suppressMessages(sim_function(N=92,tau=522,stat_value=-0.2777,k=1,r=1,
# fin_sample_corr = FALSE,sim_num=1000, seed = 333))Anna Bykhovskaya (Duke University) anna.bykhovskaya@duke.edu
Vadim Gorin (University of California at Berkeley) vadicgor@gmail.com
Eszter Kiss (Duke University) ekiss2803@gmail.com
citation("Largevars")
#> To cite Largevars in publications use:
#>
#>   Bykhovskaya A, Gorin V, Kiss E (2024). "Largevars: An R Package for
#>   Testing Large VARs for the Presence of Cointegration." _TBD_.
#>
#> A BibTeX entry for LaTeX users is
#>
#>   @Article{largevarspaper,
#>     title = {Largevars: An R Package for Testing Large VARs for the Presence of Cointegration},
#>     author = {Anna Bykhovskaya and Vadim Gorin and Eszter Kiss},
#>     journal = {TBD},
#>     year = {2024},
#> }MIT License (c) 2024